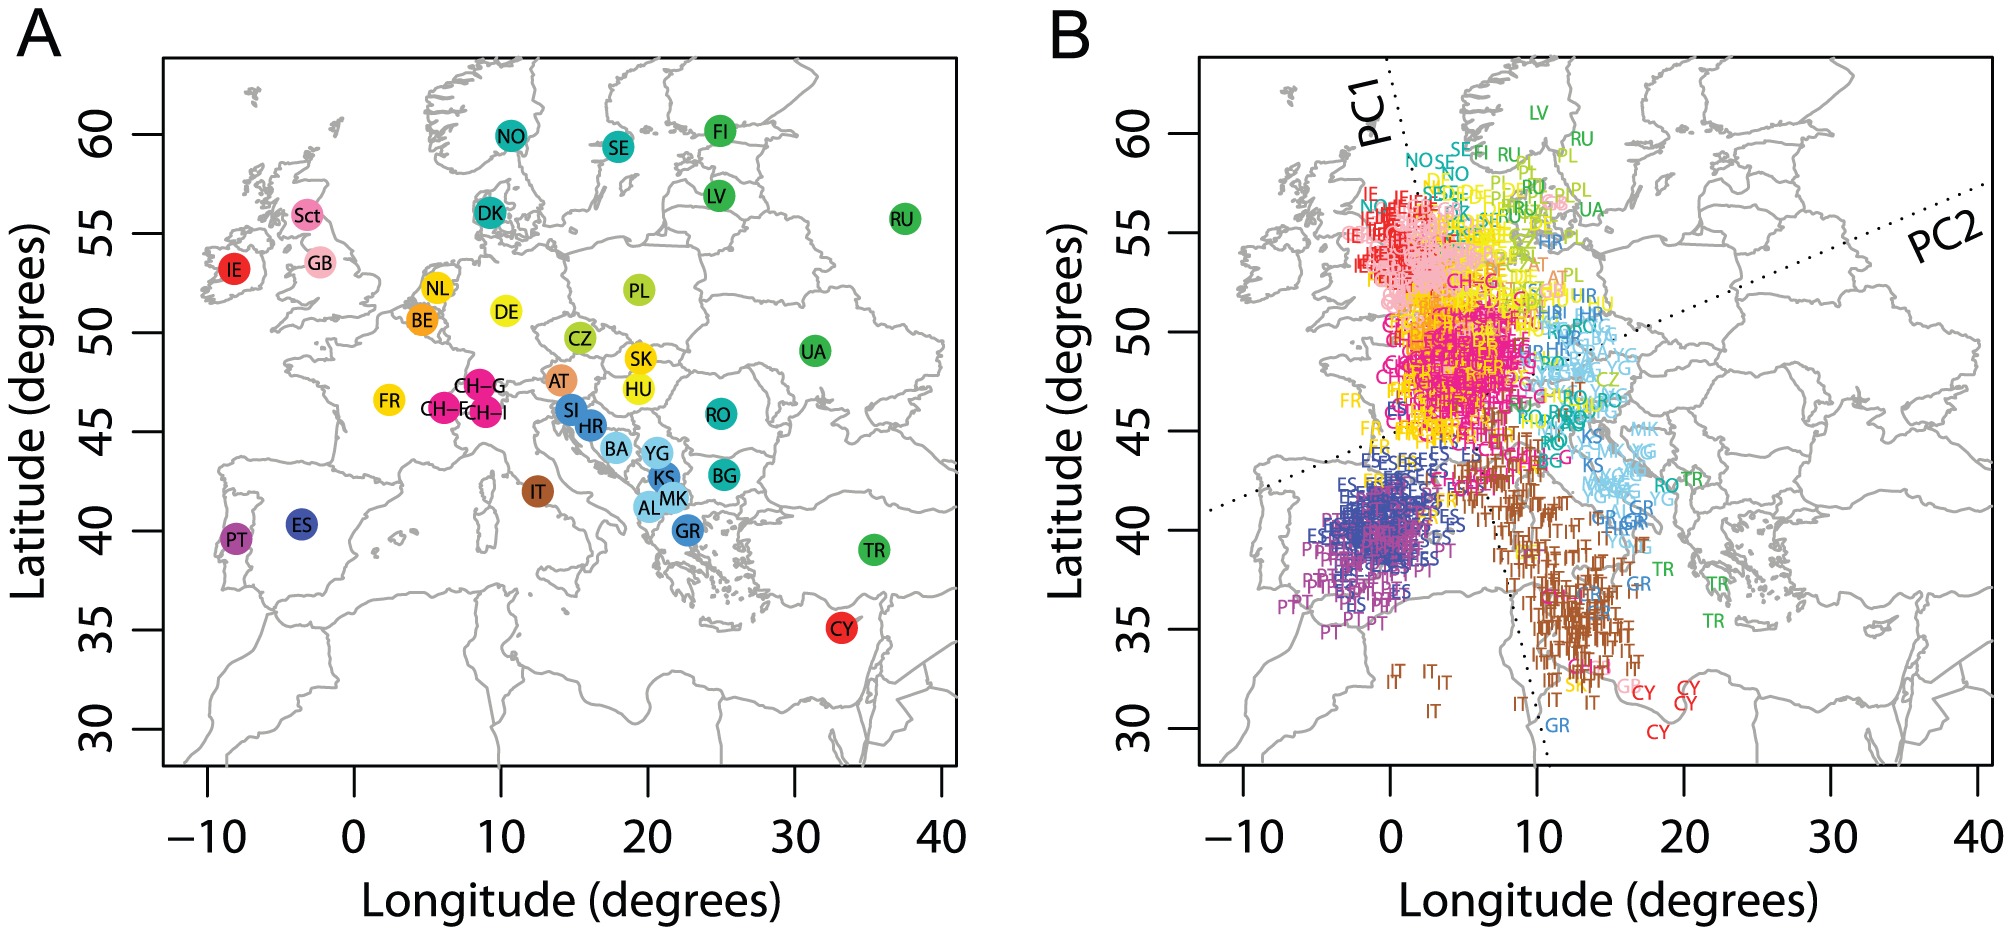
The pictures above were made by scientists who study genes. They tell a story. Two completely different kinds of information are combined to tell it: a map of Europe from our physical world and overlaid on it, the genetic relationship of 1378 people from Europe, shown in two dimensions.
The scientific paper from which the diagram comes actually looks at these patterns around the world, and similar patterns are found worldwide to a greater or lesser degree. They were not the first to notice such patterns, but they took their study worldwide. They observe: “geography plays a strong role in giving rise to human population structure“. By “structure” they mean clustering of human genetics. Geography shapes our genes, so much so that (absent recent migration) it is possible to place someone on a map of the world within a few hundred miles of their likely place of origin.
As discussed in a previous article, Y-DNA can tell us the story of patrilineal ancestry and mitochondrial DNA can be used to study maternal ancestry. The DNA used to produce the above diagram is autosomal DNA which is found on 22 pairs of the chromosomes every human being has (the 23rd pair being the X and Y chromosomes). What the scientists are looking for is the tiny differences in DNA between human beings. When the human genome was decoded scientists declared that 99.9% of human DNA is the same for all human beings: we are one human species. So it is only the tiniest differences that are used for these kinds of studies as the DNA we all share in common isn’t useful.
Nonetheless, the small differences we have as human beings add up to millions of possible points of variation in the billions of points that make up our genetic code. We can’t easily visualise the millions of differences, because it means trying to see millions of dimensions.
Techniques like “principal components analysis” are used by scientists to mathematically transform the data into a small number of dimensions, so that we can more easily understand it (for example showing it as a two dimensional diagram). This is what the picture above is. It shows the first and second principal components (dummy variables made by combining thousands of variables that explain as much as possible of variation in the DNA data). Those two dimensions in the DNA as one paper put it “mirror geography”. The result is that we can draw maps of the world just using human DNA. However we should note that the colour coding adding to the diagrams above and the labels such as “IT” and “PT” don’t come from DNA. These modern labels are about what is in a passport, not what is in DNA.
Putting that aside, that we can draw maps in which DNA traces the coastline of a continent and individuals are more or less in the “right place” is much more than an interesting coincidence. It is something about human relationships, but also something more. It is telling us how the land from which we come shapes our entire being. To put it another way, our genes are shaped by nature to help us flourish in the environment in which we are born. In a very profound sense, who we are is written in the land itself. We are not just related to our fellow human beings, we are part of a world which created us and to which we belong.
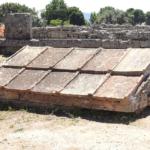
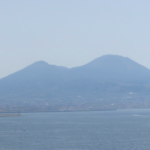
For me at a personal level, the part of the world where I feel this sense of connection with the land most is the Tavoliere, a plain near the south-eastern shore of Italy. It is not a sense of “nationality”, for it is deeper than nation. It is a sense of home. Perhaps it is just that I know that the remains of ancestors are buried there and that the land has many resonances and experiences of family. Perhaps it is a spiritual connection.
In images such as the above the focus is often on the coloured points, but again there is more going on. There are also empty spaces in these diagrams. And they have meaning. The empty spaces (which coincide with geographical features such as the Himalayas or seas) are the barriers which slow gene flow (which is to say human relationships). If these geographical barriers did not exist, it would be impossible to cluster human populations. Our genetic variation would simply show smooth gradients from north to south and east to west. As we are one we the world; we are one with each other.
Images and Sources
Procrustes transformed Principal Components Analysis of Genetic Variation in EuropeChaolong Wang , Sebastian Zöllner, Noah A. Rosenberg [CC BY 2.5 (https://creativecommons.org/licenses/by/2.5)], via Wikimedia Commons
Chaolong Wang et al., A Quantitative Comparison of the Similarity between Genes and Geography in Worldwide Human Populations, PLOS Genetics, 2012
John Novembre et al., Genes mirror geography within Europe, Nature volume 456, pages 98–101 (6 November 2008)